We’ve added a new Release Distribution chart to Changelog Analytics.
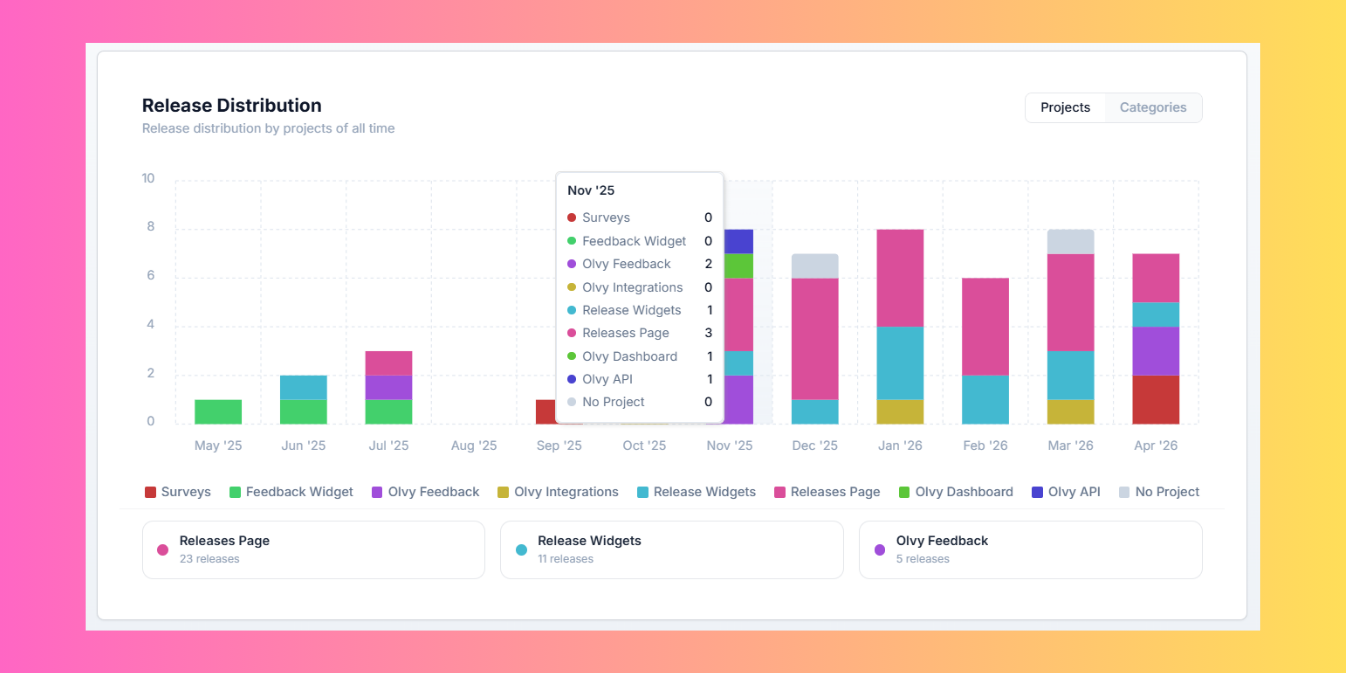
Now you can visualize how your releases are spread across different projects and categories over time - helping you understand where most of your product momentum is happening.
Track release volume across projects and categories month-by-month
Identify which areas are most active
Spot gaps or imbalances in your shipping patterns
A quick, visual way to answer: “Where are we actually shipping the most?” 🚀
🔔 Tracking Subscriber Activity (Coming Soon)
We’ve started tracking changelog subscribe and unsubscribe events behind the scenes.
While this isn’t visible in the UI just yet, it lays the foundation for upcoming insights — including a subscriber trends chart in Changelog Analytics.
Soon, you’ll be able to see how your subscriber growth (or drop) correlates with how frequently you ship 🚀
🧹 Auto-Archival for Stale Free Workspaces
As a last part of our ongoing cleanup drive, we’ve now started auto-archiving inactive free workspaces .
Free workspaces with no active users shall be auto-archived.
Data of such archived workspaces shall be permanently removed after a 3-day wait period
This helps us keep things efficient and focus on active users.
(No impact on paid workspaces - you’re all good 👍)


