We’re excited to roll out the first version of our NPS Survey Dashboard — giving you an insightful snapshot of how your users feel about your product.
📊 At a glance, here’s what you can now track:
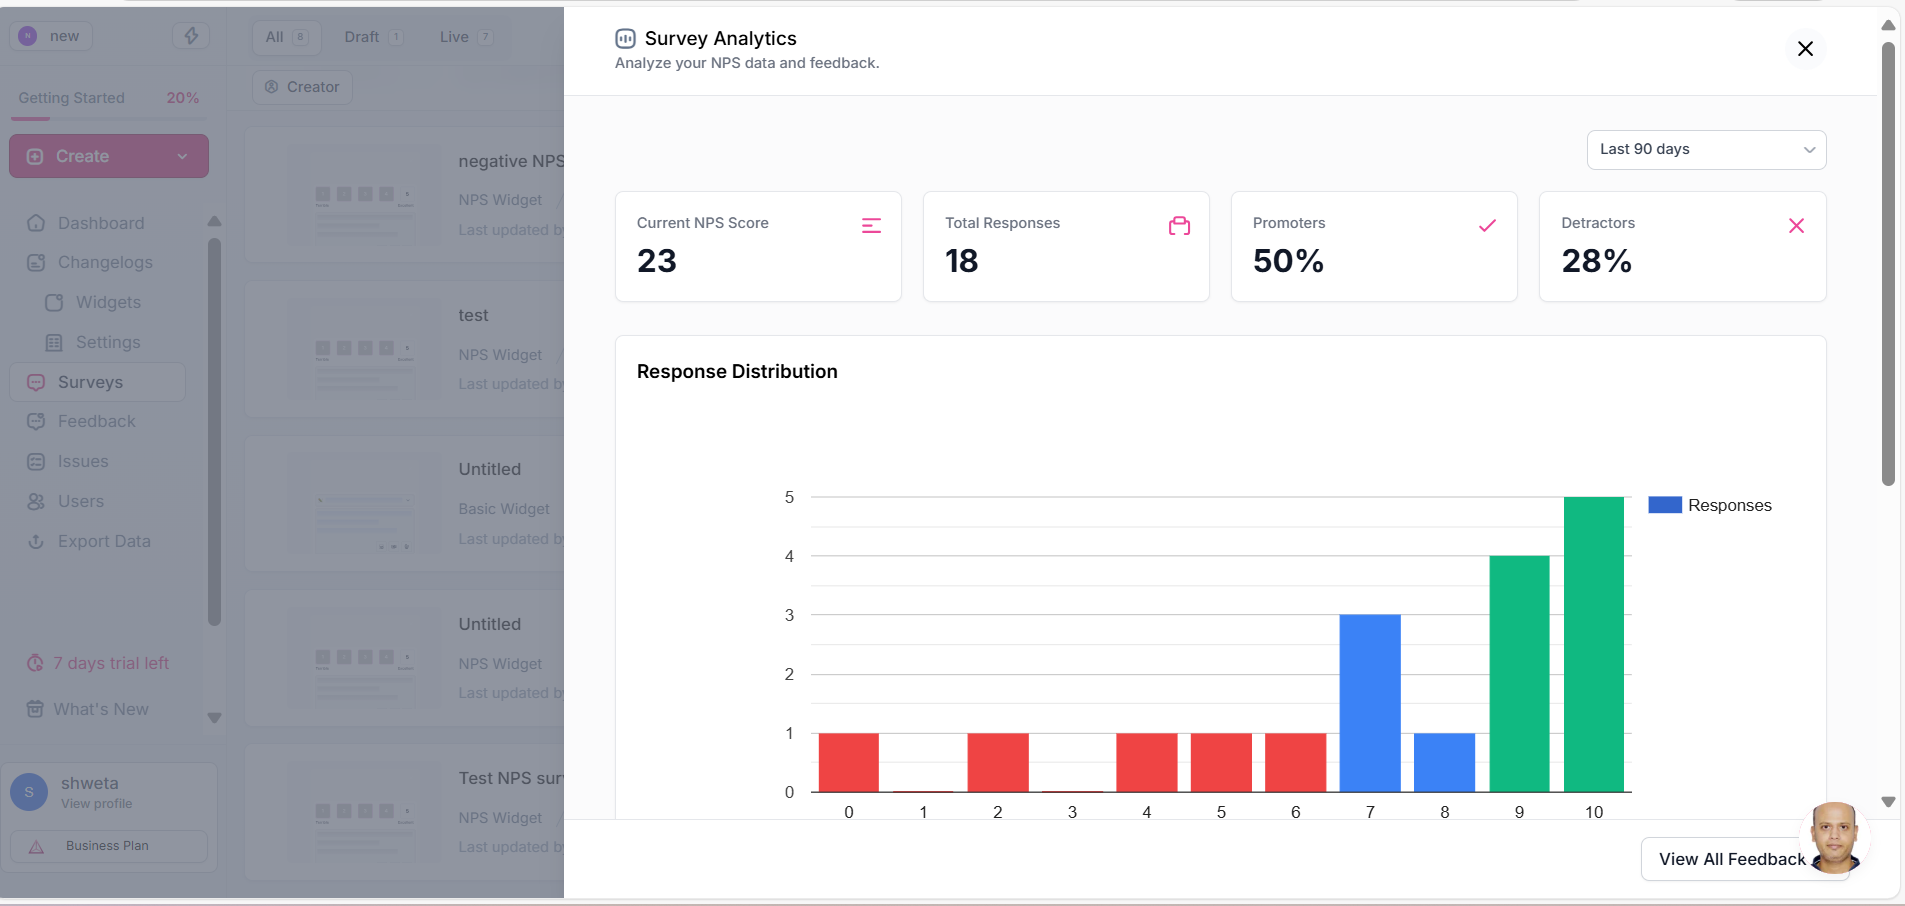
🟢 Current NPS Score
Quickly see your latest Net Promoter Score, calculated as:
% Promoters – % Detractors
💡 Hover on the score to learn how it’s calculated.
📥 Total Responses
See the total number of valid NPS responses (scores from 0 to 10).
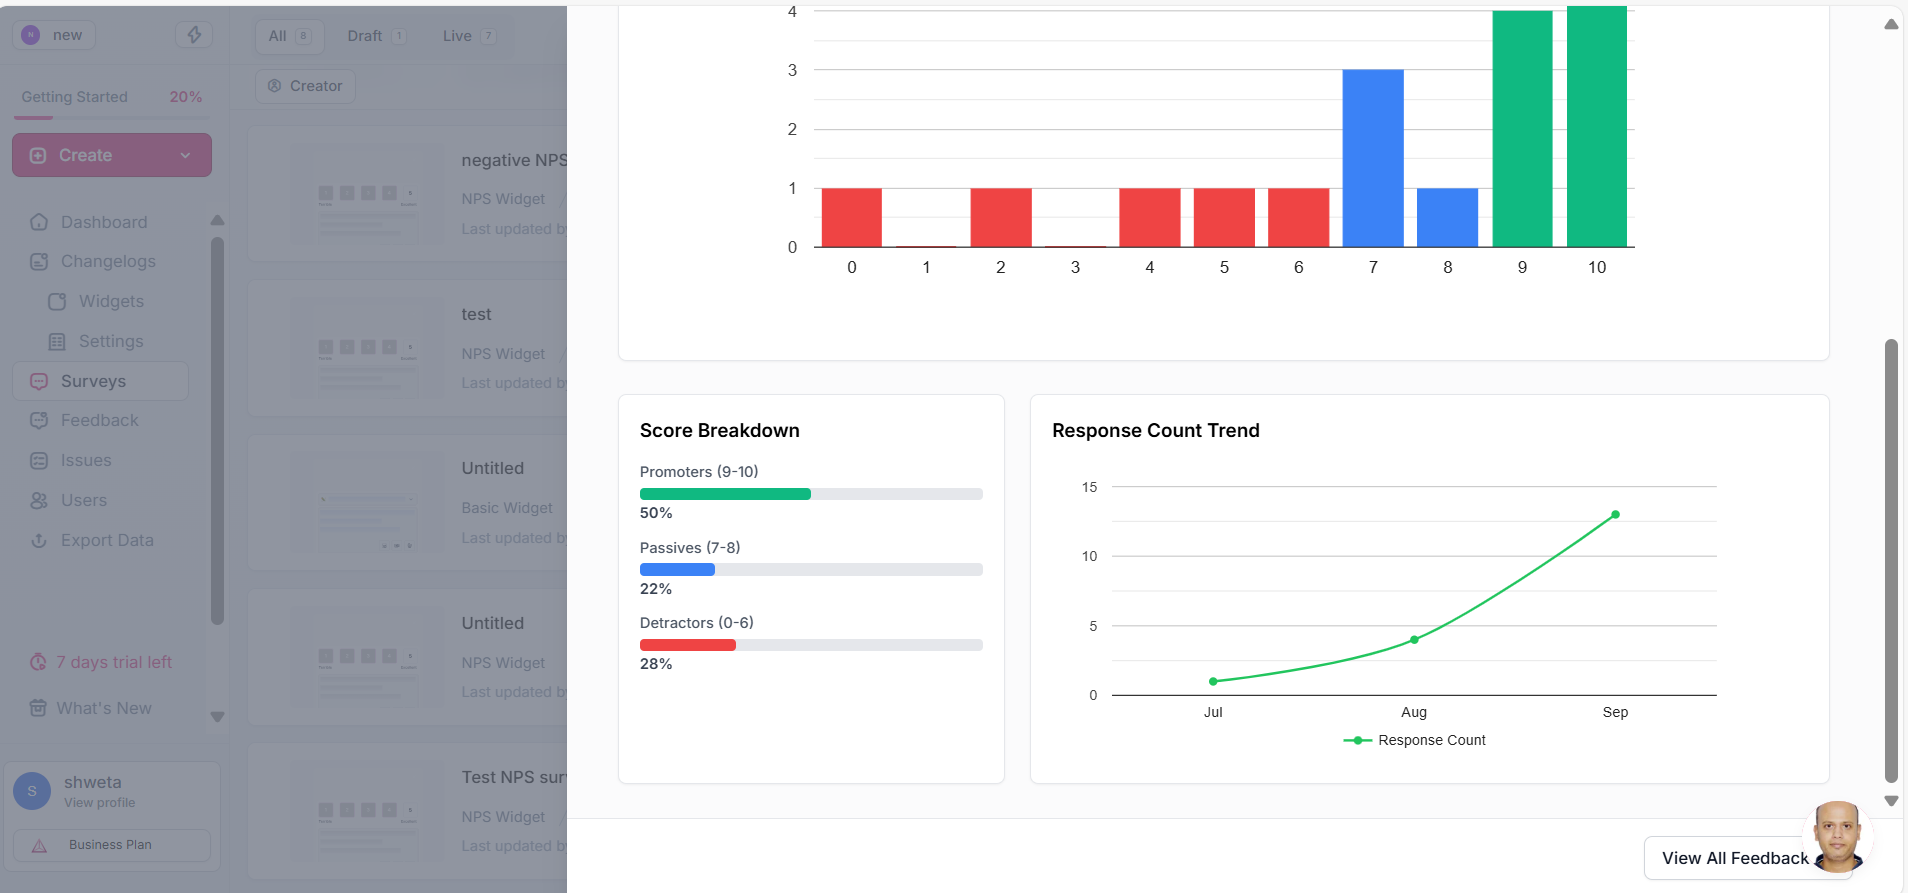
🟩 Promoters / 🔵 Passives / 🟥 Detractors
Get a clear breakdown of how your users are scoring you - including percentage and response count for each category.
📉 Response Distribution Chart
View how responses are spread across the NPS scale (0–10) with a color-coded bar chart to identify clusters of fans or critics.
📈 Response Count Trend
Track how your survey participation changes over time - perfect for spotting engagement spikes and dips month by month.

